Macroeconomic Overview
The macroeconomic environment in Bangladesh throughout the period under observation shows a developing economy juggling fiscal restraints, inflationary cycles, and growth demands.
Economic Growth
.png)
.png)
For around eleven years, Bangladesh’s GDP per capita grew remarkably, then starting in 2022, it began to decline. The rate-of-change data supports this — growth peaked in 2015 before pulling back in 2016, slowed again in 2022, and recovered to more stable levels by 2023.
Investment & Employment
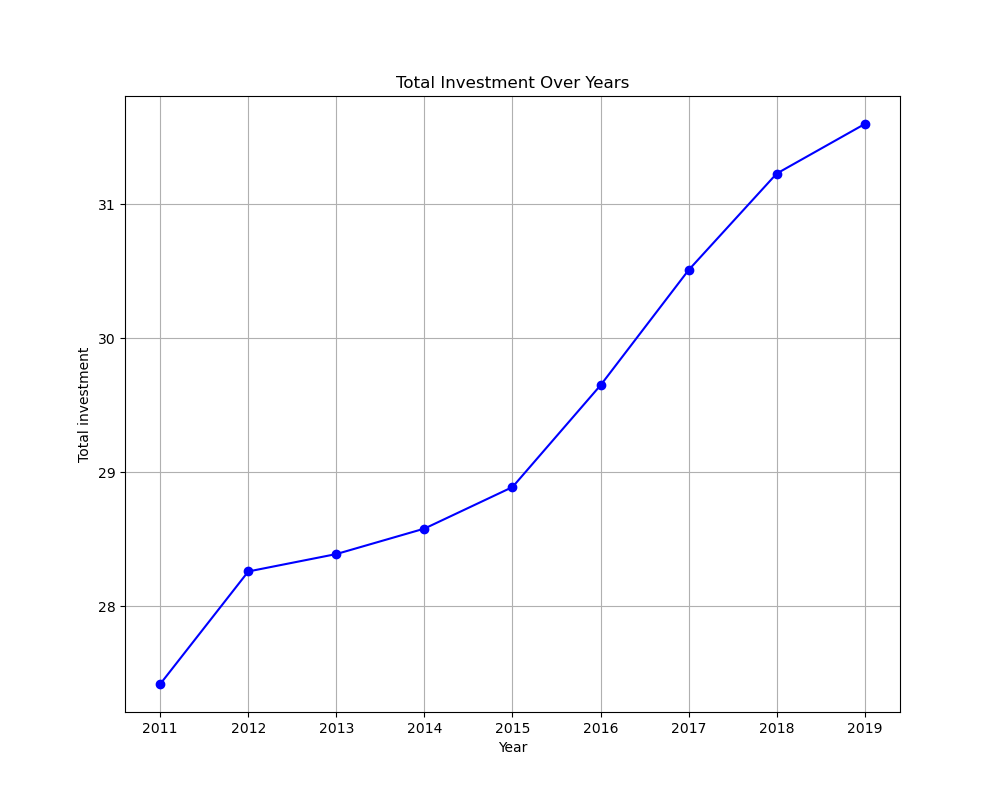
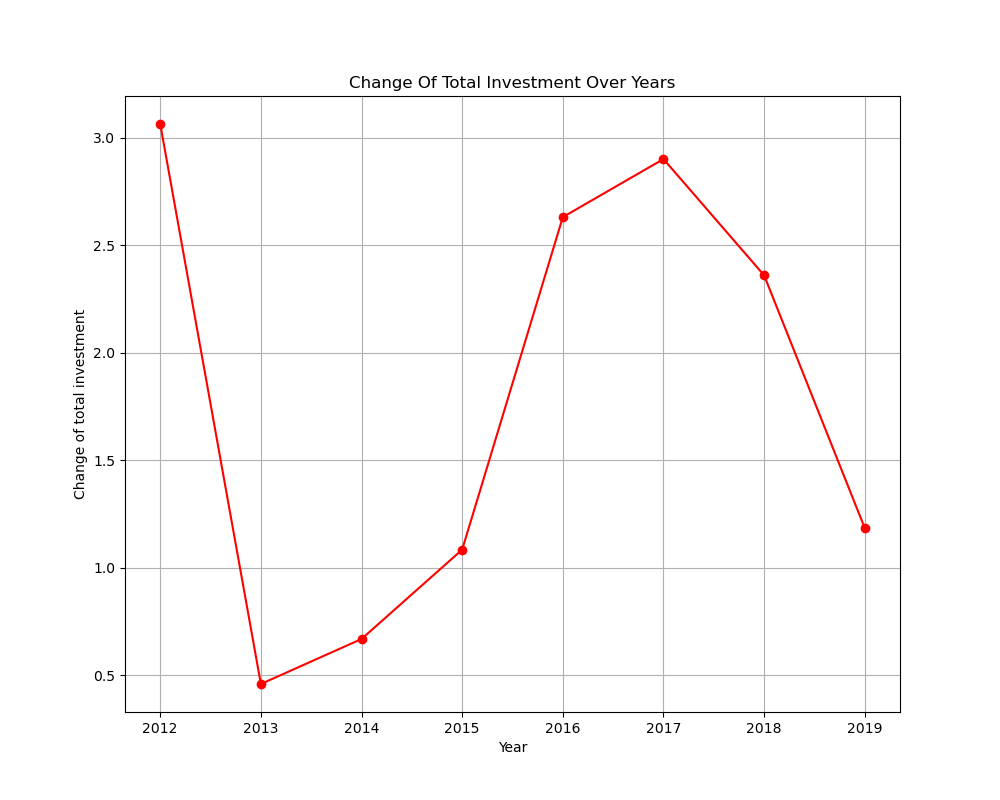
Over the course of the study, total investment steadily increased, which is a positive signal for the nation’s long-term socioeconomic development.
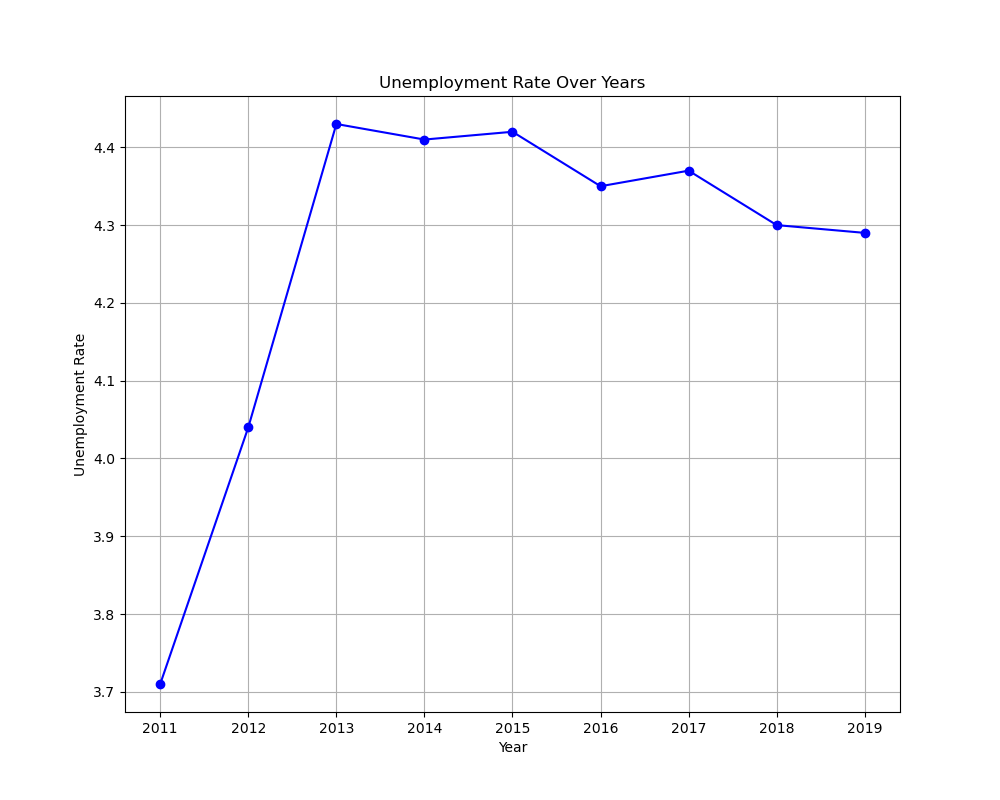
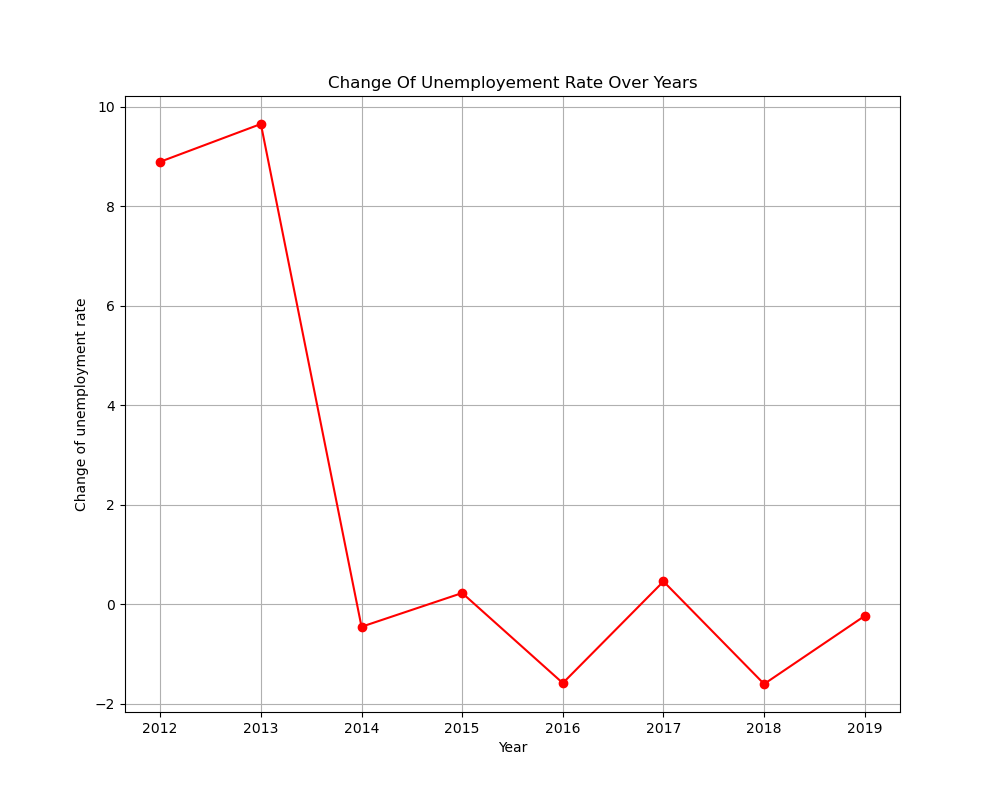
2011 saw a significant rise in unemployment despite a period of general economic expansion — a reminder that aggregate growth does not always translate immediately into job creation. By 2013, the rate had been brought down to stable levels, where it largely remained.
Price & Monetary Environment
Inflation
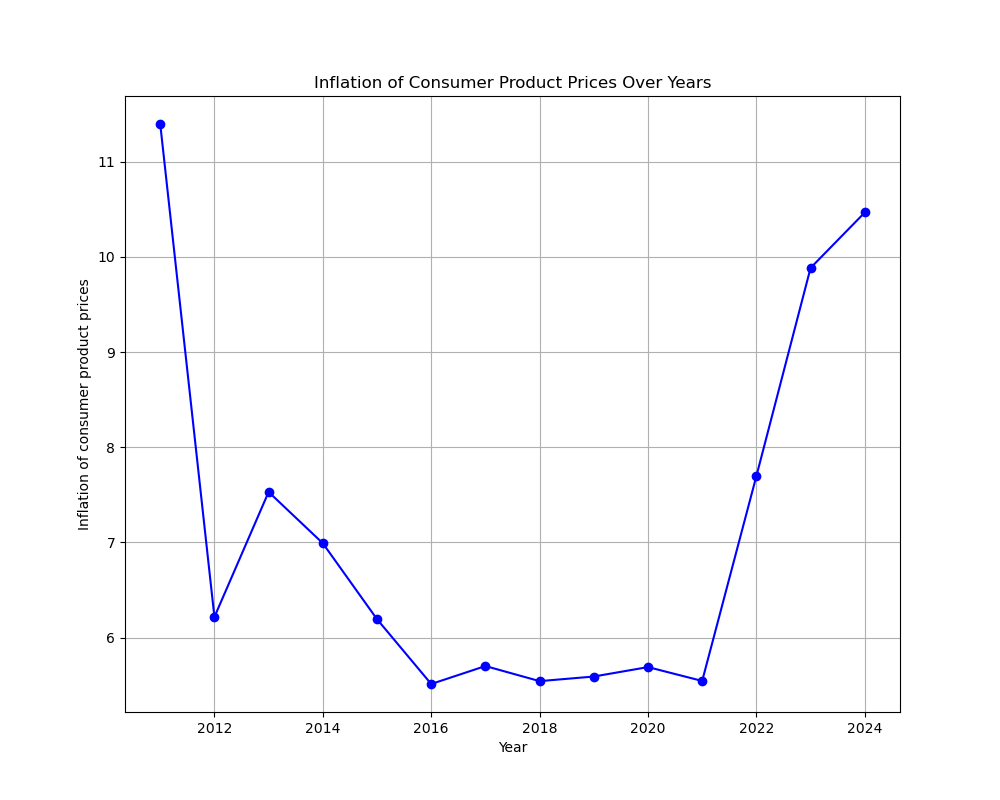
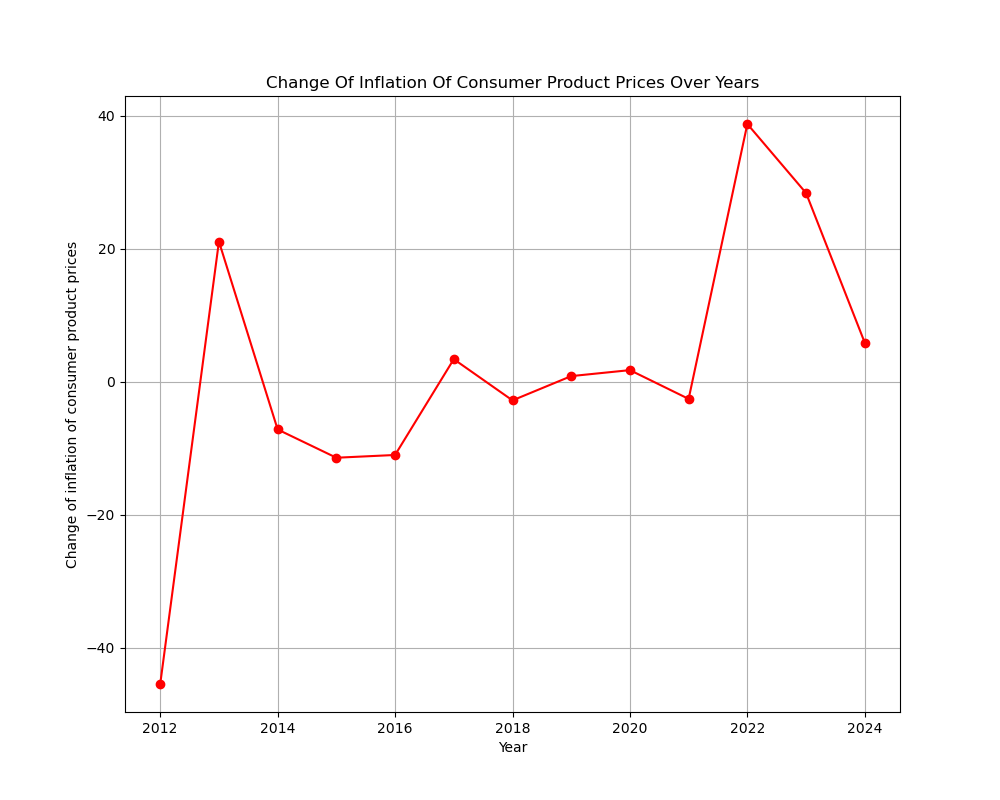
2011 proved to be an inflection point for price stability: inflation fell to nearly half its prior level and held there for close to eight years. From 2019 onwards, however, a steep reversal brought inflation back toward earlier highs — a trend that has yet to fully unwind.
Broad Money Supply
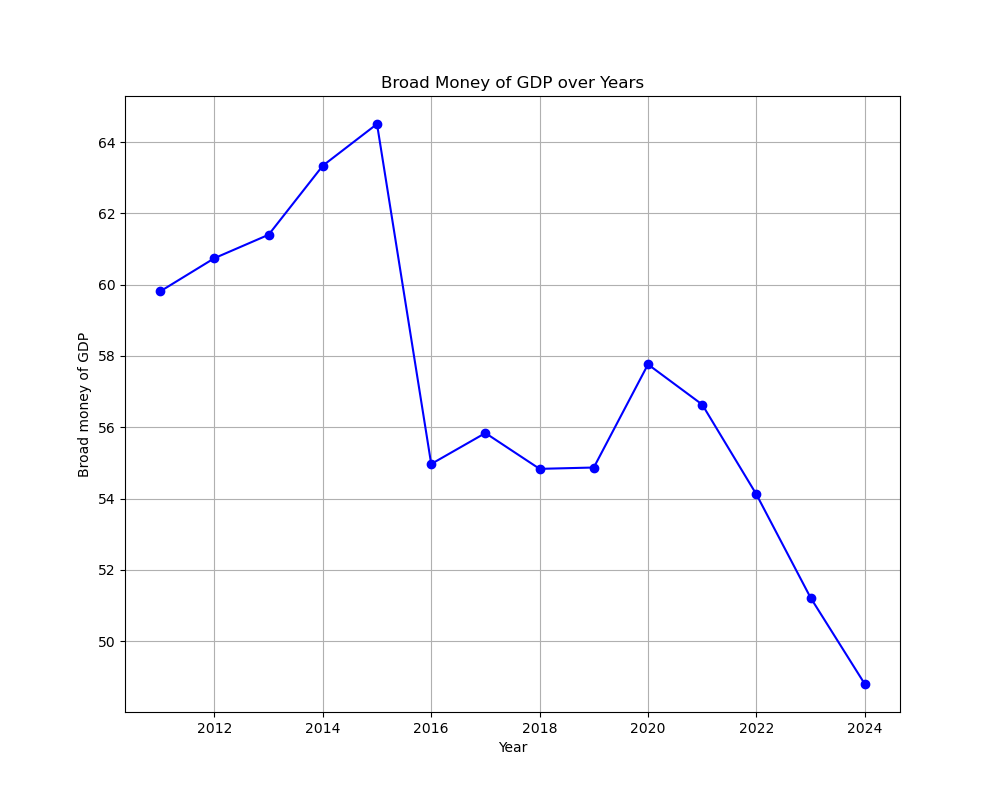
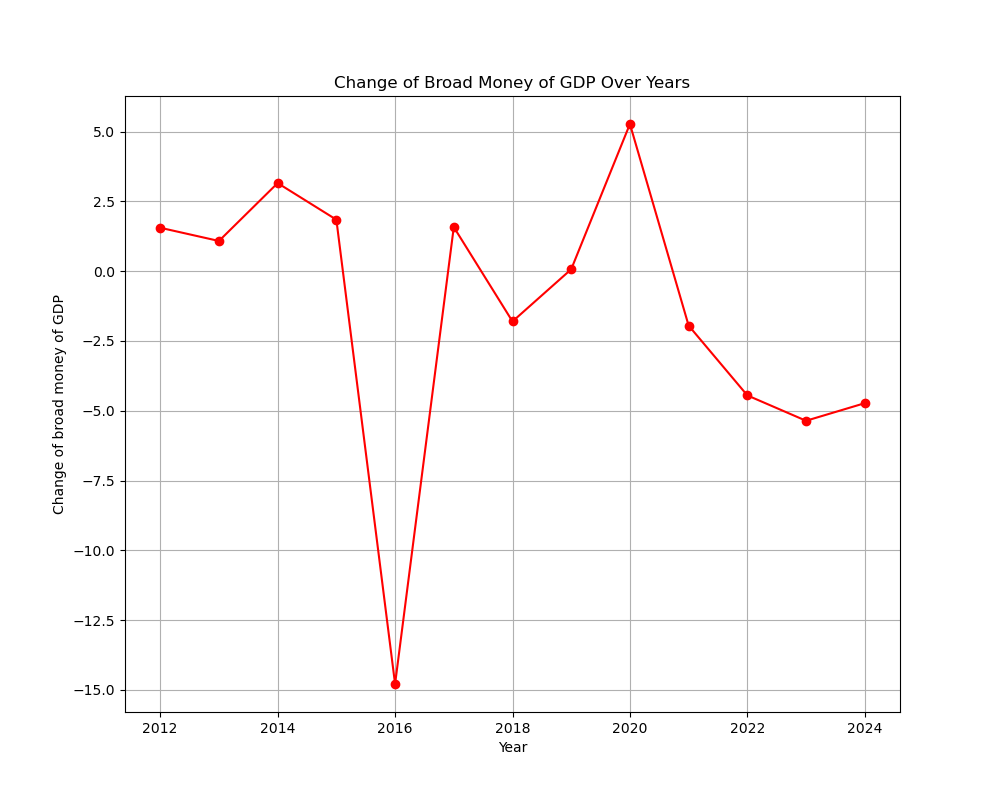
Between 2011 and 2015, broad money as a percentage of GDP increased, with two significant contractions in 2015 and 2019. The rate-of-change data presents a more sobering picture: over the majority of the period, money supply growth was negative relative to GDP, indicating that monetary expansion was decelerating even as the broader economy grew. Given the inflationary pressures that later surfaced, this divergence deserves attention.
Fiscal Position
Government Debt
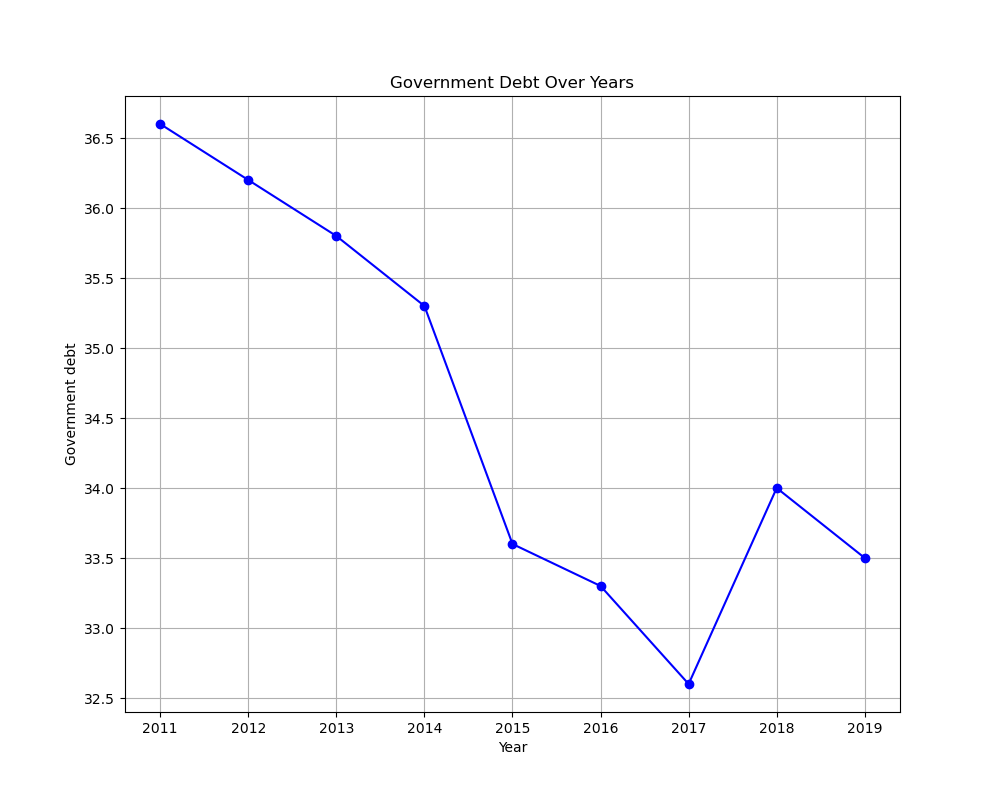
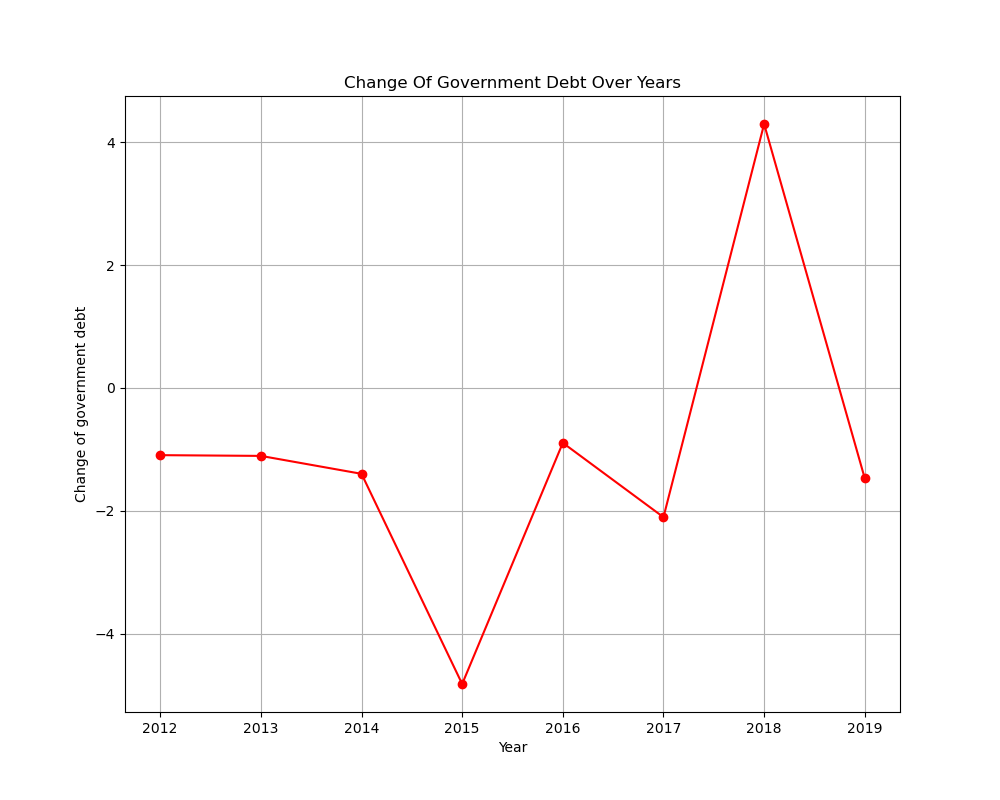
Government debt declined as a whole across the studied period. The rate-of-change data confirms this, with the average sitting in negative territory despite occasional spikes in either direction. On the surface this appears as a mark of fiscal prudence — though as explored in the synthesis section below, the relationship between public borrowing and private credit access complicates this reading.
Banking Sector — Lending Activity
The credit intermediation data presents a mixed picture. While headline totals appear relatively stable, the composition and quality of credit shifted meaningfully over the period — and not always in a healthy direction.
Total Loans
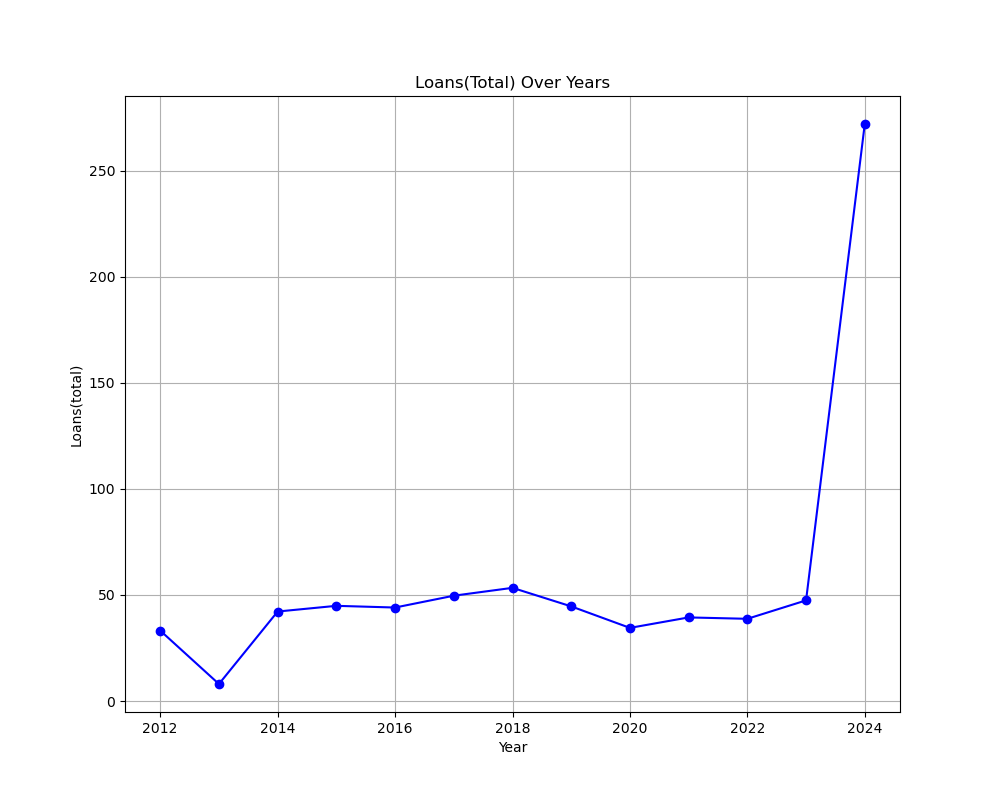
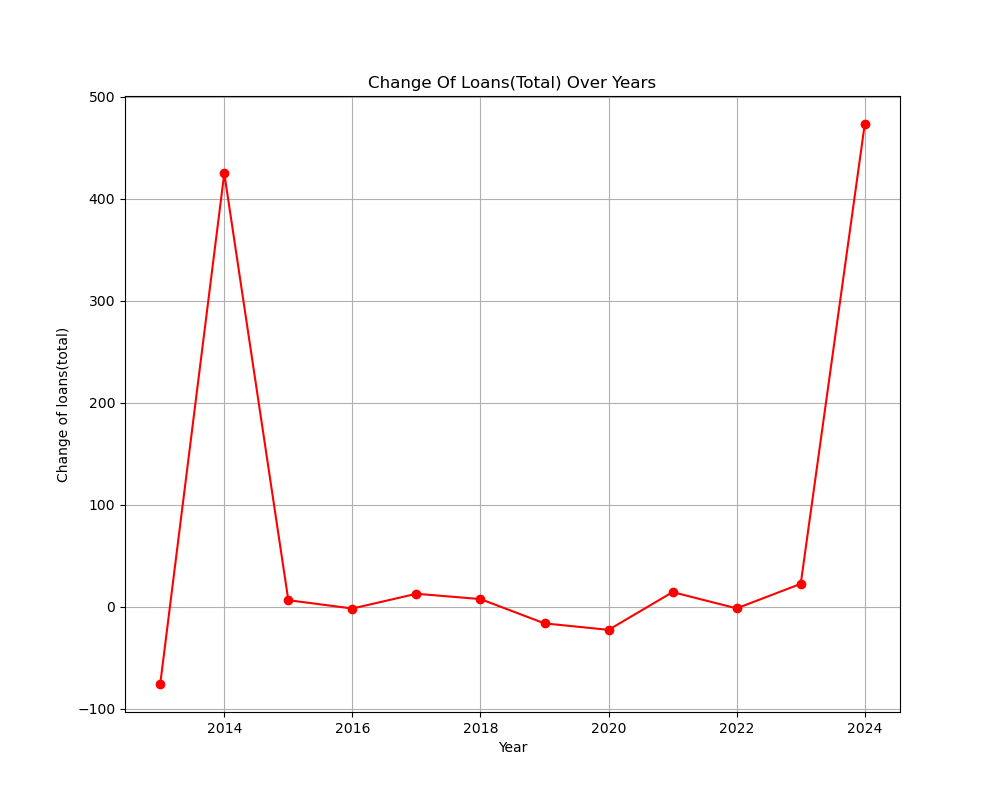
Total loans held broadly steady in nominal terms over the years, though the rate-of-change data reveals two sharp peaks in lending growth. These bursts of credit expansion, absent a corresponding improvement in loan quality, are worth reading as early warning signals in hindsight.
Domestic Credit to Private Sector
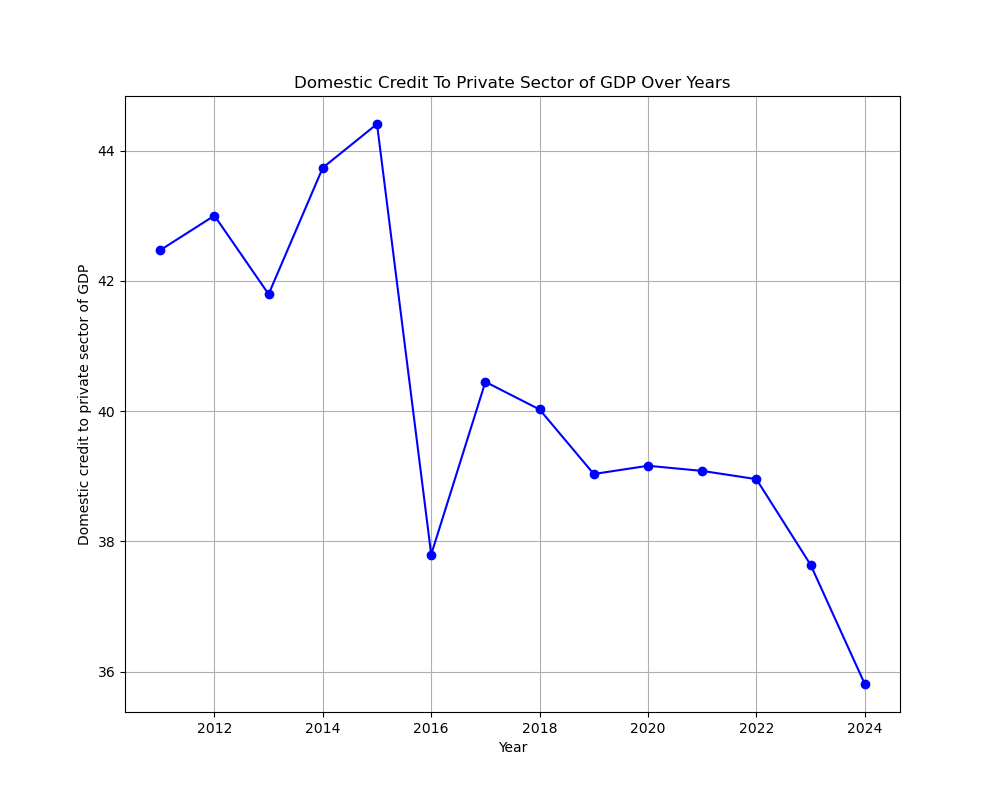
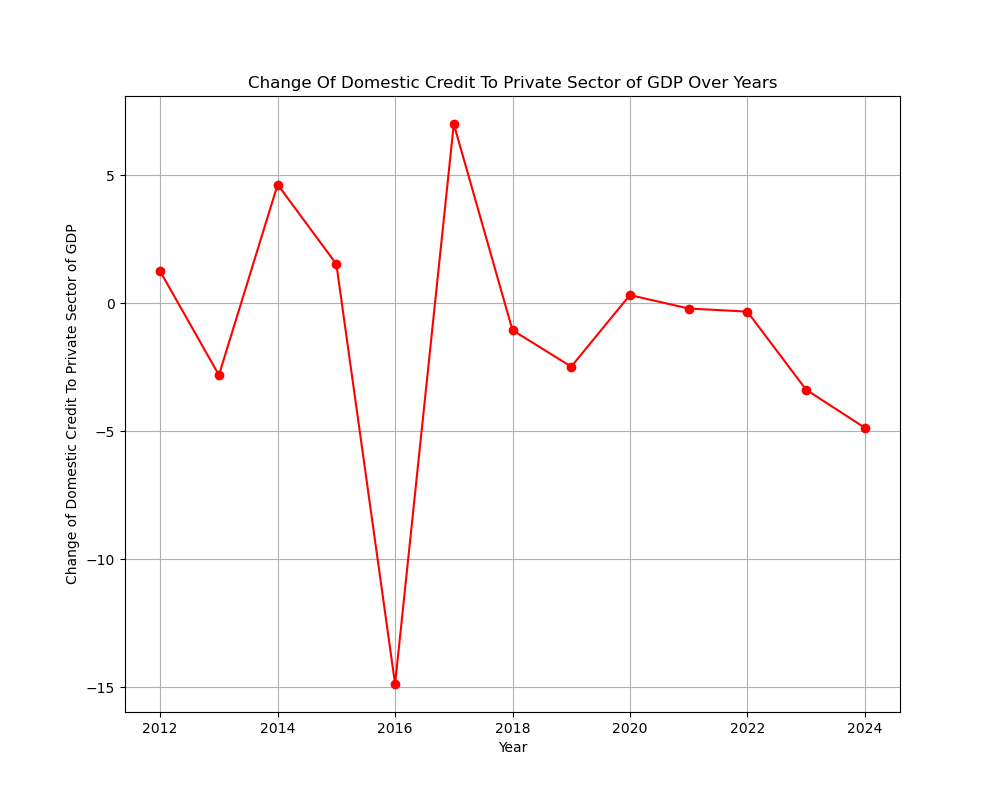
Over the course of the study, the value of domestic credit flowing to the private sector decreased — a worrying trend for an economy where private enterprise is the primary driver of growth and employment. Whether this reflects deliberate risk aversion by banks, reduced creditworthy demand, or crowding-out from public sector borrowing is addressed in the synthesis section.
Banking Sector — Health & Risk
Liquidity Position
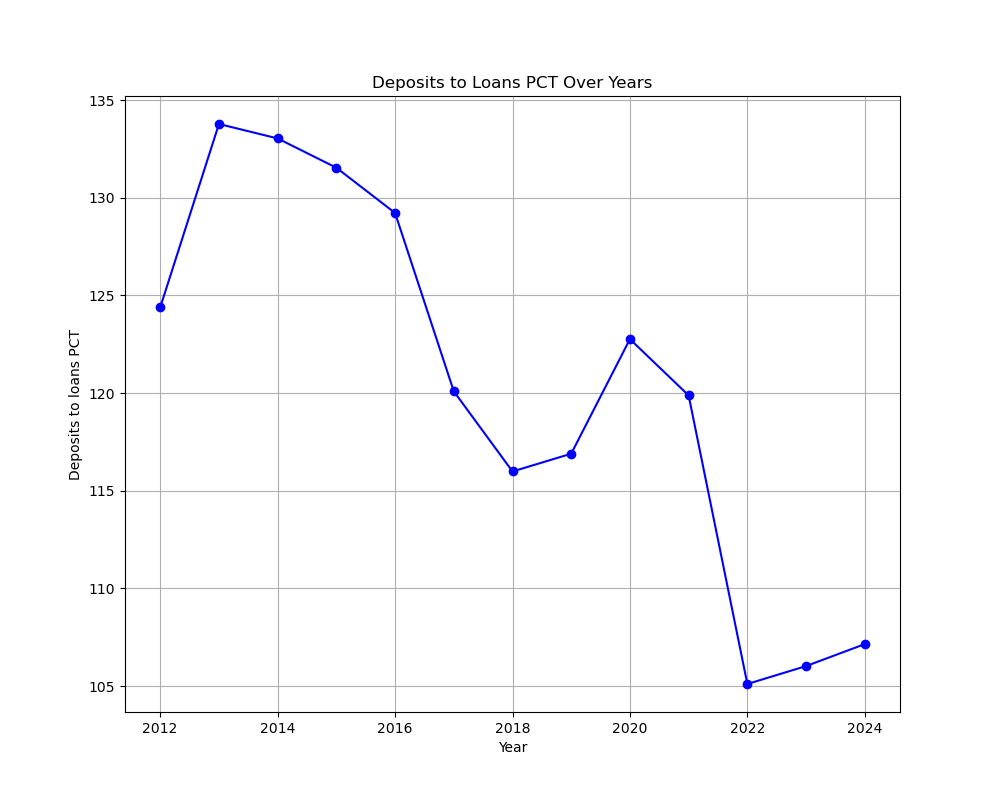
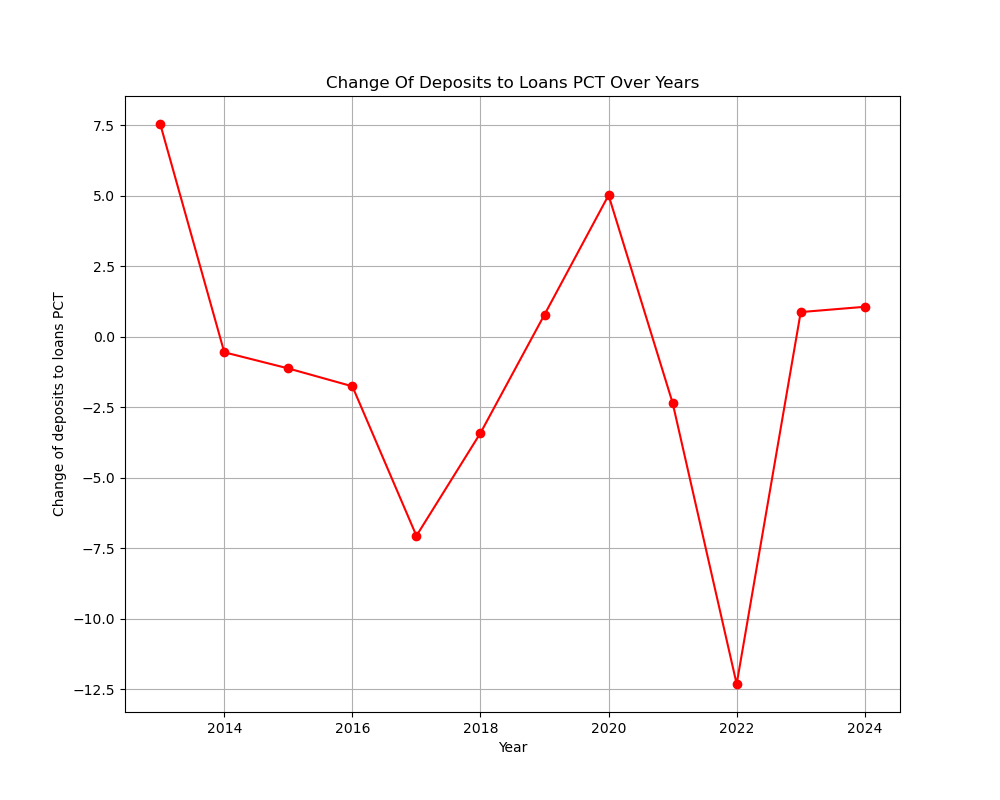
The deposits-to-loans ratio declined consistently across the studied period. A falling ratio sustained over a decade indicates that loan books were growing faster than deposit funding — or that deposits were eroding — both of which point to a structurally thinner liquidity cushion in the banking system.
Loan Quality
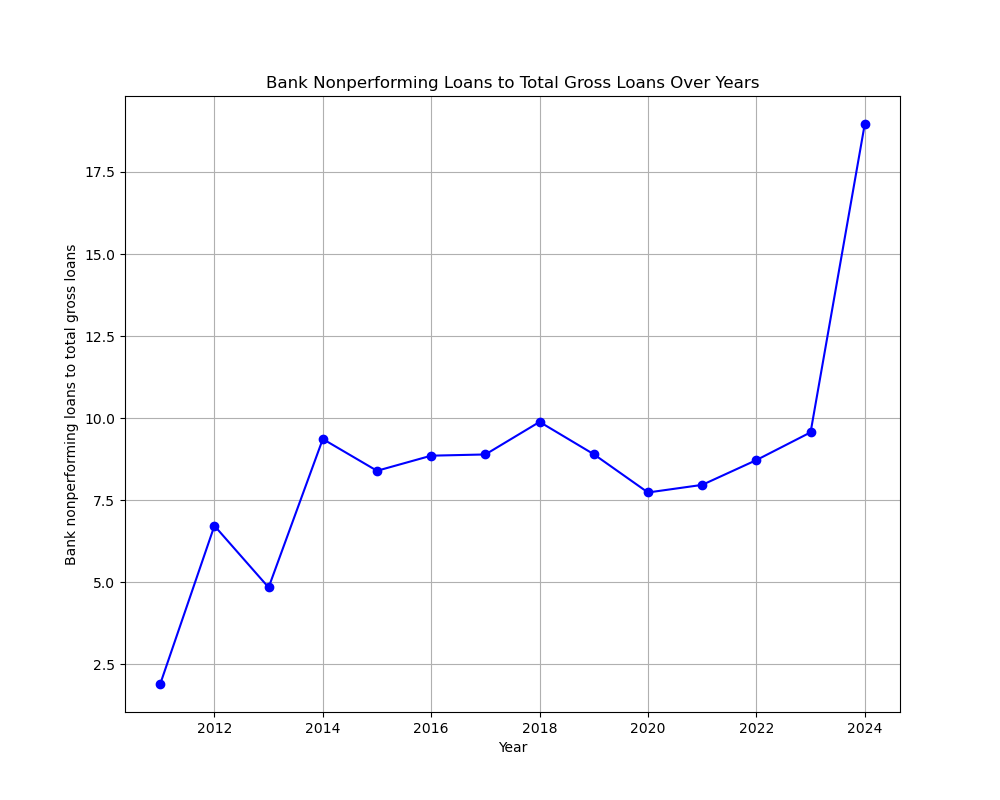
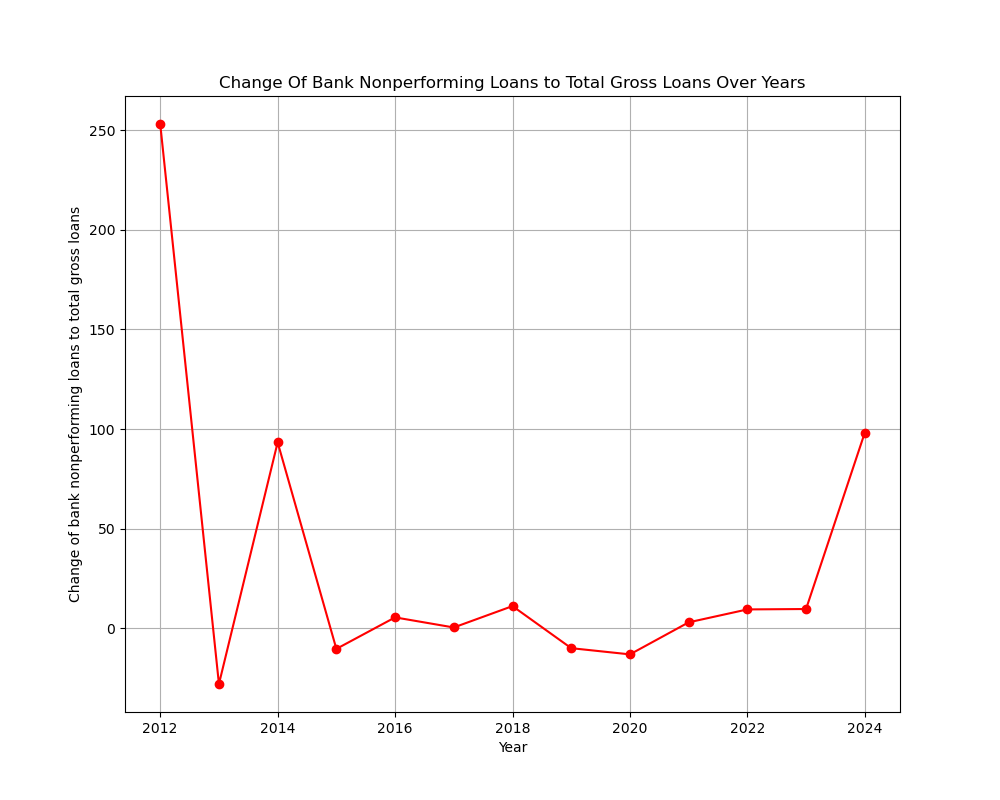
The non-performing loans data is the most telling indicator in this section — and likely the primary driver behind the deteriorating deposits-to-loans picture. NPLs rose steadily across the period, with particularly sharp jumps in 2011 and 2024. A banking system carrying an expanding stock of bad debt cannot efficiently recycle capital into productive lending, and the downstream effects of this are visible across nearly every other credit indicator.
Synthesis: Growth above the surface, tension underneath
Did economic slowdown drive the banking stress?
There is a clear lag in the relationship between GDP per capita growth and NPL accumulation. Around 2019–2020, growth began to slow down, and in the years that followed, non-performing loans accelerated — consistent with the typical one-to-two year transmission lag in which number of borrowers which expanded during a growth cycle begins defaulting once revenues slow.
Credit Boom and Bust Cycle
Private sector credit expanded through the mid-2010s, broadly coinciding with the period of strong GDP growth and rising investment. This expansion, however, was not matched by improvements in underwriting discipline — as the subsequent steady rise in non-performing loans makes clear.
Monetary Expansion and Price Effects
Broad money growth broadly tracks the inflation trajectory with a short lag, and the relationship holds in both directions. The relative price stability between roughly 2012 and 2019 coincided with a period in which monetary expansion, while positive, was moderating — suggesting reasonable calibration during that window. The inflationary resurgence from 2019 onwards aligns with renewed monetary loosening, likely driven by government financing pressures and post-pandemic liquidity support.
Fiscal Pressure on the Banking Sector
Government debt as a share of GDP declined over the studied period, which on its face appears fiscally responsible. However, the declining domestic credit to the private sector over the same window suggests a possible crowding-out dynamic: as the government continued drawing on domestic financial markets, private borrowers faced tighter credit availability and higher effective borrowing costs!